
Realtors Association of Edmonton Stats
General Sentiment, News & Stats
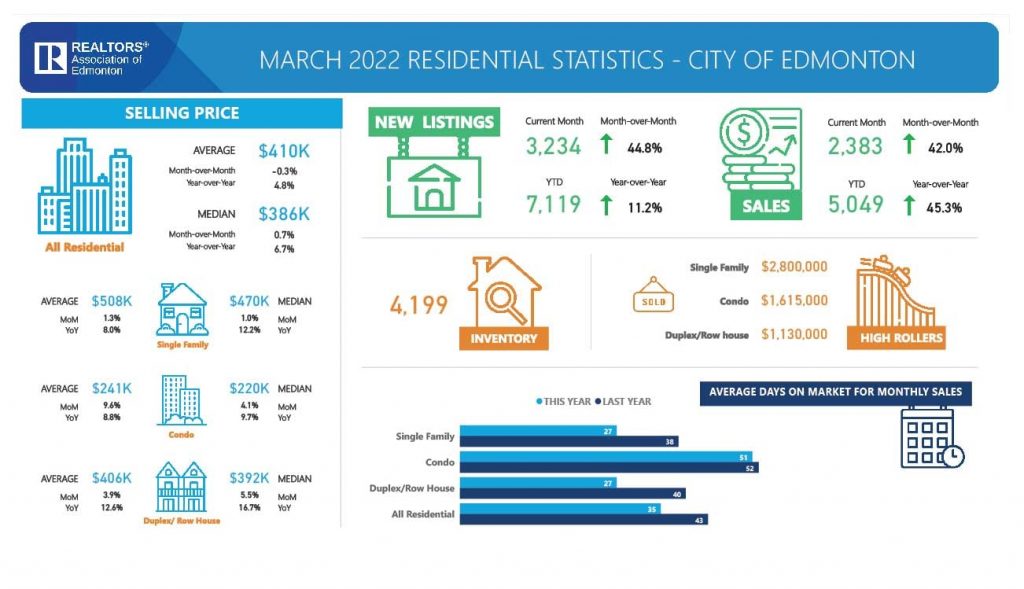
Total residential unit sales in the Greater Edmonton Area (GEA) real estate market for March 2022 increased 45.4% compared to February 2022 and increased 34.7% from March 2021. New residential listings increased both 7.6% year-over-year and 47.7% month-over-month from February 2022.
For March, single-family home unit sales are up 21.2% from March 2021 and up 37.7% from February 2022 at 1,920. Condo unit sales increased 67.1% from March 2021 and were up 62.9% from February 2022. Duplex/rowhouse unit sales were up 54.2% year-over-year and increased 45.1% month-over-month.
Single-family homes averaged $503,711, a 9.9% year-over-year increase and a month-over-month increase of 2.0%. Condominiums sold for an average of $245,070, seeing an increase of 6.7% year-over-year as well as an 8.4% increase compared to February 2022. Duplex prices increased 11.8% from March 2021, selling at $389,321, a 3.8% increase from February 2022.
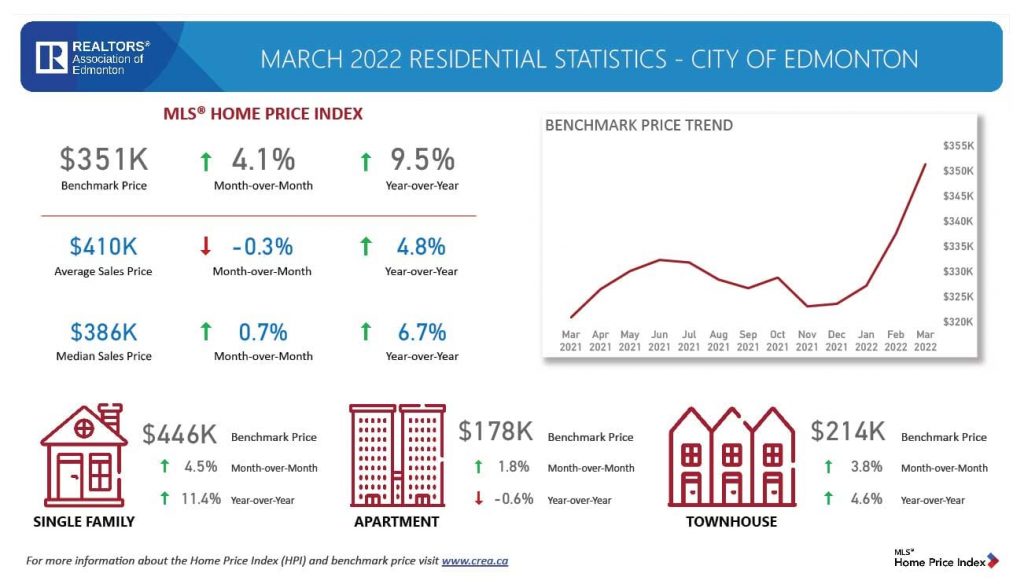
The MLS® Home Price Index (HPI) composite benchmark price* in the GEA came in at $369,700, a 9.4% increase from March 2021, and up 4.5% from February 2022.
“The Greater Edmonton and Area market continues to surprise us as we enter into what is normally the start of the busy season of real estate,” says REALTORS® Association of Edmonton Chair Paul Gravelle. “Although we are seeing slightly lower increases for average sale prices across all categories, there has been a huge increase in the number of listings hitting the market as well the number of sales in the month of March.”
Single-family homes averaged 27 days on the market, a 15-day decrease from February 2022. Condos averaged 51 days on the market, decreasing by 10 days month-over-month, while duplexes averaged 29 days on the market, a 13-day decrease compared to last month. Overall, all residential listings averaged 34 days on the market, decreasing by eight days year-over-year and down 13 days as compared to February 2022.
*The MLS® Home Price Index (HPI) is a measure of real estate prices that provides a clearer picture of market trends over traditional tools such as mean or median average prices. It is designed to be a reliable, consistent, and timely way of measuring changes in home prices over time. You can find more information on the following pages.
| Contact: | |
| Paul Gravelle, REALTOR®, 2022 Chair | 780-965-7369 |
| Madeleine Burlin, Communications Manager | 780-453-9302 |
| Allan Font, CPA, CMA, CAE, CRAE, Interim President & CEO | 780-453-9361 |
Review these statistics and more at www.realtorsofedmonton.com.
| MLS® HPI Benchmark Price* | March 2022 | M/M % Change | Y/Y % Change |
| (for all-residential sales in GEA1) | |||
| SFD2 benchmark price | $449,500 | 4.9% | 10.9% |
| Apartment benchmark price | $180,400 | 1.5% | -0.6% |
| Townhouse benchmark price | $219,000 | 3.7% | 4.3% |
| Composite7 benchmark price | $369,700 | 4.5% | 9.4% |
What is the MLS® HPI Benchmark Price? Find out here.
| MLS® System Activity 2022 | March 2022 | M/M % Change | Y/Y % Change |
| (for all-residential sales in GEA1) | |||
| SFD2 average3 selling price – month | $503,711 | 2.1% | 9.9% |
| SFD median4 selling price – month | $468,075 | 1.7% | 11.4% |
| Condominium average selling price | $245,070 | 8.4% | 6.7% |
| Condominium median selling price | $225,000 | 3.4% | 7.1% |
| All-residential5 average selling price | $414,788 | 0.7% | 5.9% |
| All-residential median selling price | $395,000 | 2.6% | 7.6% |
| # residential listings this month | 4,298 | 47.7% | 7.6% |
| # residential sales this month | 3,283 | 45.4% | 34.7% |
| # residential inventory at month end | 5,265 | 10.0% | -21.5% |
| # Total6 MLS® System sales this month | 3,877 | 47.5% | 27.1% |
| $ Value Total residential sales this month | $1,414,258,676 | 48.0% | 42.2% |
| $ Value of total MLS® System sales – month | $1,622,688,341 | 41.4% | 35.0% |
| $ Value of total MLS® System sales – YTD | $3,329,996,076 | 89.7% | 32.8% |
Source:
The REALTORS® Association of Edmonton (Edmonton Real Estate Board)
March 2022 Housing Statistics, Posted on: April 04, 2022

Inflation Watch
Home price to gold?
This fascinating calculation will let you know if your house is really gaining value against gold. Or, is the measuring stick shrinking in actuality?
Let’s look at how many ounces of gold it takes to buy the average house in Edmonton.
Feb 2022 $470,000 Median House Price / $2,409 for an ounce of gold = 195.1 oz of gold to buy the median house
Historical Edmonton Data:
Mar 2022 – 195.1 oz of gold to buy the median house
Feb 2022 – 191.1 oz of gold to buy the median house
Jan 2022 – 184.5 oz of gold to buy the median house
Jan 2010 – 253.4 oz of gold to buy the median house
Jan 2000 – 238.6 oz of gold to buy the median house
Jan 1990 – 97.6 oz of gold to buy the median house
Jan 1980 – 29.6 oz of gold to buy the median house
Calgary Jan 2022 – 224.9 oz of gold to buy the median house
Fort McMurray Jan 2022 – 215.3 oz of gold to buy the median house
Saskatoon Jan 2022 – 160.1 oz of gold to buy the median house
Toronto Jan 2022 – 568.4 oz of gold to buy the median house!
Vancouver Jan 2022 – 536.5 oz of gold to buy the median house!
What does this tell us? It gives us a gauge on home price inflation in Edmonton.
- If takes more gold (than previous months) to buy a house, the median house has appreciated against gold. This can signal home price inflation and that homes are becoming less affordable for the average Edmontonian.
- If takes less gold (than previous months) to buy a house, the median house is losing value to gold. This is a sign that Edmonton homes are depreciating in “actual value”, even though your home may sell for more money than last year. Other commodities are likely growing in value more than Edmonton real estate.
- If there is little change, things are stable.
- Gold will tend to perform well during financial crisis, while house prices tend to drop.
- My “Home Price to Gold” ratio is calculated by dividing the median sales price of a single family home in Edmonton by todays (post date) gold price for a 1 ounce coin in CAD.
- The median house price is the exact middle home price amongst all the single family homes sold this month in Edmonton (e.g. half the homes sold for less, half sold for more).
Buy Versus Rent (Price-to-Rent Ratio)
Mar 2022: $220,000 / ($1,200 X 12) = 15.27
Historical Data – Price-to-Rent Ratio:
Mar 2022 – 15.27
Feb 2022 – 14.19
Jan 2022 – 12.65
Historical Data – condominium median selling price:
Mar 2022 – $220,000
Feb 2022 – $211,000
Jan 2022 – $188,000
Historical Data – Average rent for a two-bedroom unit in Edmonton:
Mar 2022 – $1,200
Feb 2022 – $1,239
Jan 2022 – $1,238
What does this tell us? This calculation helps us keep on eye on rental rates as well as general ROI with Edmonton investment properties.
- A price-to-rent ratio of 15 or less means it’s generally better to buy.
- A price-to-rent ratio of 21 or more means it’s generally better to rent.
- In-between? That means politicians are somehow doing a good a good job.
- MY price-to-rent ratio is calculated by dividing the condominium median selling price by THIS months average rent for a 2-bedroom apartment in Edmonton.
- Note: this is a very simplified calculation and a sophisticated buyer should consider many more data points such as neighborhood, types of condominium, family size, future plans, etc.
National Statistics
- National home sales rose 4.6% on a month-over-month basis in February.
- Actual (not seasonally adjusted) monthly activity came in 8.2% below the record February in 2021.
- The number of newly listed properties bounced back by 23.7% month-over-month.
- The MLS® Home Price Index (HPI) rose a record 3.5% month-over-month and was up a record 29.2% year-over-year.
- The actual (not seasonally adjusted) national average sale price posted a 20.6% year-over-year gain in February.
Source:
The Canadian Real Estate Association (CREA)
Ottawa, ON, Mar 15, 2022
Other News For Edmonton
On track: progress on Capital Line South LRT extension in Edmonton in 2022
Readout: Alberta and Canada discuss federal climate plan
New legislation spurs innovation in finance sector
Alberta calls on Ottawa to halt the carbon tax increase
Promoting Alberta’s financial and business advantages

Subscribe To Get This Report To Your Inbox!
Would you like to keep an eye on your most important investment?
Looking to invest in the Edmonton market?
Get this one-of-a-kind report every month for free!