
General Sentiment, News & Stats
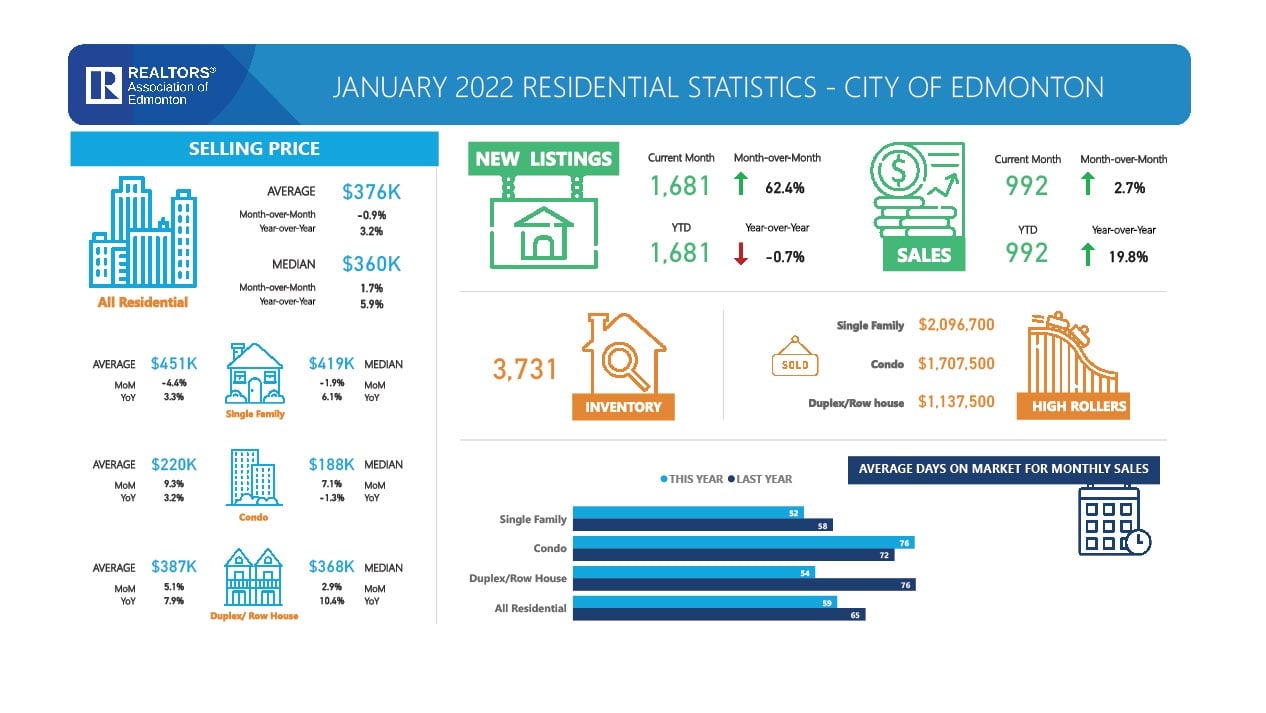
Total residential unit sales in the Greater Edmonton Area (GEA) real estate market for January 2022 increased 1.5% compared to December 2021 and increased 14.4% from January 2021.
New residential listings decreased 8.9% year-over-year from January 2021. However, new residential listings are up month-over-month, increasing 55.7% from December 2021. Overall inventory in the GEA was down 14.8% from January of last year but increased 5.0% from December 2021.
For January, single-family home unit sales are up 10.0% from January 2021 and up 3.5% from December 2021 at 811. Condo unit sales increased 21.6% from January 2021 and decreased 0.9% from December 2021. Duplex/rowhouse unit sales were up 19.1% year-over-year and down 3.0% month-over-month.
All residential average prices are at $376,923, a 1.1% decrease from December 2021, and a 3.5% increase from January 2021. Single-family homes averaged $445,932, a 4.3% year-over-year increase and a 3.6% decrease from December 2021. Condominiums sold for an average of $224,566, a 3.7% increase year-over-year, and prices are up 3.5% compared to December 2021. Duplex prices increased 11.1% from January 2021, selling at $382,471, a 5.4% increase from December 2021.
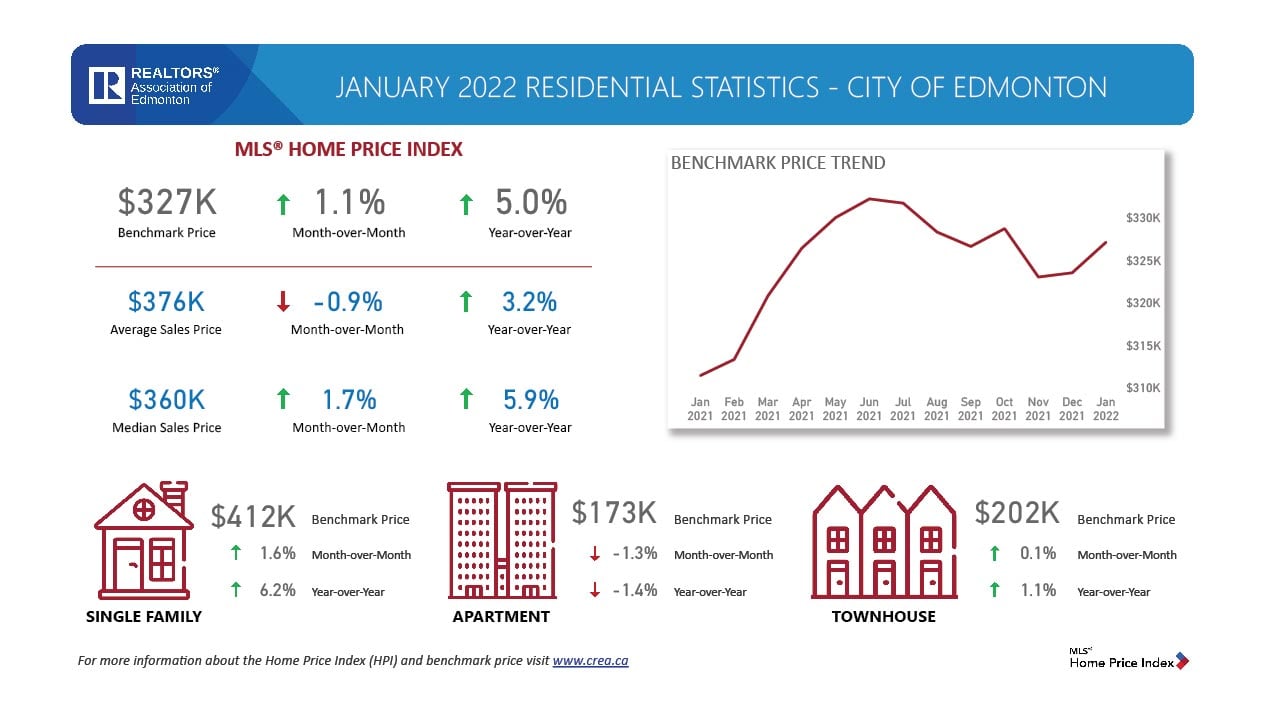
| MLS® HPI Benchmark Price* | Jan. 2022 | M/M % Change | Y/Y % Change |
| (for all-residential sales in GEA) | |||
| SFD benchmark price | $416,000 | 1.2% | 6.1% |
| Apartment benchmark price | $176,200 | -1.2% | -0.9% |
| Townhouse benchmark price | $207,500 | 0.1% | 0.6% |
| Composite benchmark price | $344,300 | 0.9% | 5.1% |
What is the MLS® HPI Benchmark Price? Find out here.
Source:
The REALTORS® Association of Edmonton (Edmonton Real Estate Board)
January 2022 Housing Statistics, Posted on: February 02, 2022

Inflation Watch
Home price to gold?
This fascinating calculation will let you know if your house is really gaining value against gold. Or, is the measuring stick shrinking in actuality?
Let’s look at how many ounces of gold it takes to buy the average house in Edmonton.
Jan 2022 $419,000 Median House Price / $2,270 for an ounce of gold = 184.5 oz of gold to buy the median house
Historic Edmonton Data:
Jan 2022 – 184.5 oz of gold to buy the median house
Jan 2010 – 253.4 oz of gold to buy the median house
Jan 2000 – 238.6 oz of gold to buy the median house
Jan 1990 – 97.6 oz of gold to buy the median house
Jan 1980 – 29.6 oz of gold to buy the median house
Calgary Jan 2022 – 224.9 oz of gold to buy the median house
Fort McMurray Jan 2022 – 215.3 oz of gold to buy the median house
Saskatoon Jan 2022 – 160.1 oz of gold to buy the median house
Toronto Jan 2022 – 568.4 oz of gold to buy the median house!
Vancouver Jan 2022 – 536.5 oz of gold to buy the median house!
What does this tell us? It gives us a gauge on home price inflation in Edmonton.
- If takes more gold (than previous months) to buy a house, the median house has appreciated against gold. This can signal home price inflation and that homes are becoming less affordable for the average Edmontonian.
- If takes less gold (than previous months) to buy a house, the median house is losing value to gold. This is a sign that Edmonton homes are depreciating in “actual value”, even though your home may sell for more money than last year. Other commodities are likely growing in value more than Edmonton real estate.
- If there is little change, things are stable.
- Gold will tend to perform well during financial crisis, while house prices tend to drop.
- My “Home Price to Gold” ratio is calculated by dividing the median sales price of a single family home in Edmonton by todays (post date) gold price for a 1 ounce coin in CAD.
- The median house price is the exact middle home price amongst all the single family homes sold this month in Edmonton (e.g. half the homes sold for less, half sold for more).
Buy Versus Rent (Price-to-Rent Ratio)
Jan 2022: $188,000 / ($1,238 X 12) = 12.65
- A price-to-rent ratio of 15 or less means it’s generally better to buy.
- A price-to-rent ratio of 21 or more means it’s generally better to rent.
- In-between? That means politicians are somehow doing a good a good job.
- My price-to-rent ratio is calculated by dividing the median price for an apartment building by THIS months median rent for a 2-bedroom apartment in Edmonton.
- Note: this is a very simplified calculation and a sophisticated buyer should consider many more data points such as neighborhood, family size, future plans, etc.
Realtors Association of Edmonton Stats
National Statistics
- National home sales inched up 0.2% on a month-over-month basis in December.
- Actual (not seasonally adjusted) monthly activity came in 9.9% below the record posted in December 2020.
- The number of newly listed properties fell 3.2% from November to December.
- The MLS® Home Price Index (MLS® HPI) rose 2.5% month-over-month and was up a record 26.6% year-over-year.
- The actual (not seasonally adjusted) national average sale price posted a 17.7% year-over-year gain in December.
Source:
The Canadian Real Estate Association (CREA)
Ottawa, ON, January 17, 2022
Other News For Edmonton
Alberta to reach emissions reduction goal by 2025
Alberta’s venture capital industry gets a boost
Date Night in Edmonton: Winter Edition
Outdoor Ice Skating in Edmonton

Subscribe To Get This Report To Your Inbox!
Would you like to keep an eye on your most important investment?
Looking to invest in the Edmonton market?
Get this one-of-a-kind report every month for free!