
Realtors Association of Edmonton Stats
General Sentiment, News & Stats
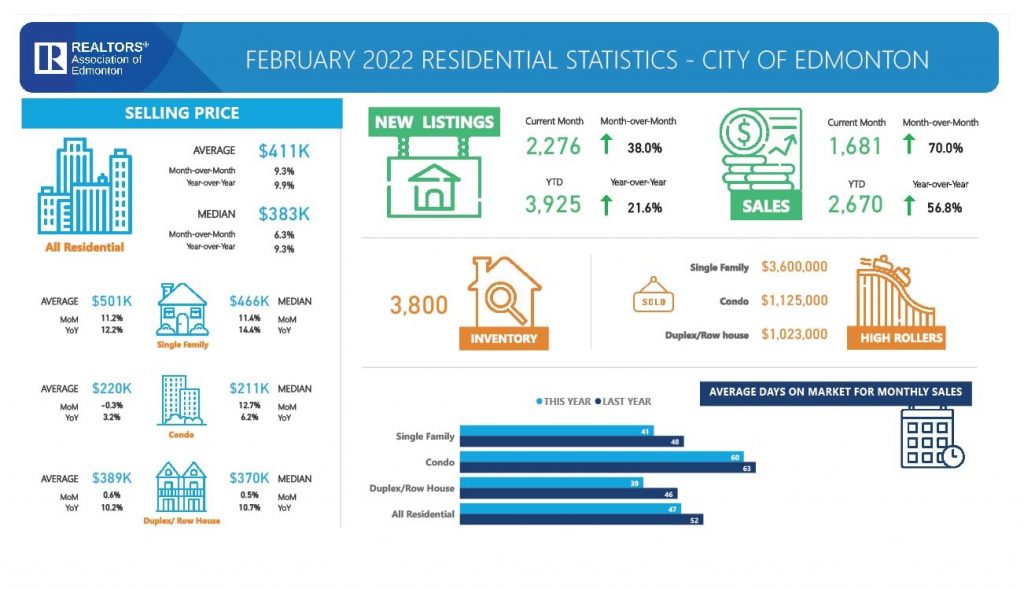
Total residential unit sales in the Greater Edmonton Area (GEA) real estate market for February 2022 increased 69.3% compared to January 2022 and increased 41.7% from February 2021.
New residential listings increased both 13.7% year-over-year and 39.6% month-over-month from January 2022.
For February, single-family home unit sales are up 35.6% from February 2021 and up 71.9% from January 2022 at 1,394. Condo unit sales increased 55.2% from February 2021 and were up 62.9% from January 2022. Duplex/rowhouse unit sales were up 55.9% year-over-year and increased 87.7% month-over-month.
Single-family homes averaged $493,543, a 12.7% year-over-year increase and a month-over-month increase of 10.8%. Condominiums sold for an average of $226,811, a 1.8% decrease year-over-year, and prices are up 0.9% compared to January 2022. Duplex prices increased 9.1% from February 2021, selling at $374,290, a 2.1% decrease from January 2022.
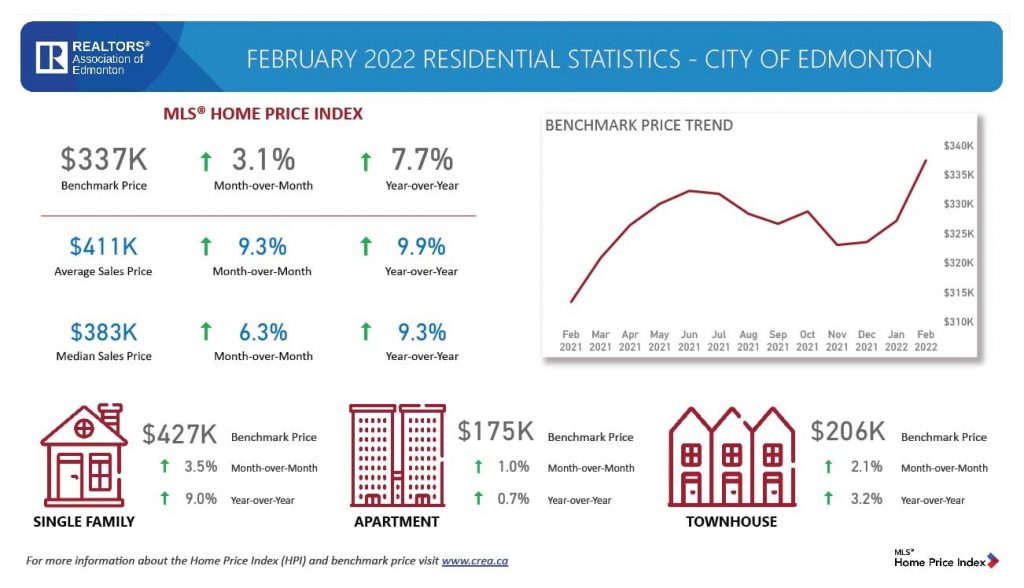
The MLS® Home Price Index (HPI) composite benchmark price* in the GEA came in at $353,900, a 6.9% increase from February 2021, and up 2.8% from January 2022.
“We continue to see incredible momentum emerging out of the Greater Edmonton Area real estate market as we head into the warmer months,” says REALTORS® Association of Edmonton Chair Paul Gravelle. “We saw huge increases in our month-over-month activity for residential listings and sales for the month of February.”
Single-family homes averaged 42 days on the market, a five-day decrease from February of last year. Condos averaged 61 days on the market, decreasing by one day year-over-year, while duplexes averaged 42 days on the market, a six-day decrease compared to February 2021. Overall, all residential listings averaged 47 days on the market, decreasing by five days year-over-year and down 10 days as compared to January 2022.
*The MLS® Home Price Index (HPI) is a measure of real estate prices that provides a clearer picture of market trends over traditional tools such as mean or median average prices. It is designed to be a reliable, consistent, and timely way of measuring changes in home prices over time. You can find more information on the following pages.
Review these statistics and more at www.realtorsofedmonton.com.
| MLS® HPI Benchmark Price* | Feb. 2022 | M/M % Change | Y/Y % Change |
| (for all-residential sales in GEA1) | |||
| SFD2 benchmark price | $428,700 | 3.1% | 7.8% |
| Apartment benchmark price | $177,700 | 0.9% | 1.1% |
| Townhouse benchmark price | $211,100 | 1.7% | 2.3% |
| Composite7 benchmark price | $353,900 | 2.8% | 6.9% |
What is the MLS® HPI Benchmark Price? Find out here.
| MLS® System Activity 2022 | Feb.2022 | M/M % Change | Y/Y % Change |
| (for all-residential sales in GEA1) | |||
| SFD2 average3 selling price – month | $493,543 | 10.8% | 12.7% |
| SFD median4 selling price – month | $460,000 | 9.5% | 12.6% |
| Condominium average selling price | $226,811 | 0.9% | -1.8% |
| Condominium median selling price | $218,000 | 13.5% | 3.8% |
| All-residential5 average selling price | $411,464 | 9.1% | 8.9% |
| All-residential median selling price | $385,000 | 5.5% | 6.1% |
| # residential listings this month | 2,962 | 39.6% | 13.7% |
| # residential sales this month | 2,258 | 69.3% | 41.7% |
| # residential inventory at month end | 4,786 | 1.4% | -19.2% |
| # Total6 MLS® System sales this month | 2,629 | 62.8% | 30.2% |
| $ Value Total residential sales this month | $955,330,583 | 81.4% | 50.7% |
| $ Value of total MLS® System sales – month | $1,147,628,608 | 83.5% | 54.8% |
| $ Value of total MLS® System sales – YTD | $1,755,826,723 | 180.8% | 34.5% |
1 Greater Edmonton Area (Edmonton and municipalities in the four surrounding counties)
2 Single-family Dwelling
3 Average: The total value of sales in a category divided by the number of properties sold
4 Median: The middle figure in an ordered list of all sales prices
5 Residential includes SFD, condos, duplex/row houses and mobile homes
6 Includes residential, rural and commercial sales
7 Includes SFD, condos, duplex/row houses and mobile homes
3Average prices indicate market trends only. They do not reflect actual changes for a particular property, which vary from house to house and area to area. Sales are compared to the month end reports from the prior period and do not reflect late reported sales. The RAE trading area includes communities beyond the GEA (Greater Edmonton Area) and therefore average and median prices include sold properties outside the GEA. For information on a specific area, contact your local REALTOR®.
Source:
The REALTORS® Association of Edmonton (Edmonton Real Estate Board)
Feb 2022 Housing Statistics, Posted on: March 02, 2022

Inflation Watch
Home price to gold?
This fascinating calculation will let you know if your house is really gaining value against gold. Or, is the measuring stick shrinking in actuality?
Let’s look at how many ounces of gold it takes to buy the average house in Edmonton.
Feb 2022 $466,000 Median House Price / $2,439 for an ounce of gold = 191.1 oz of gold to buy the median house
Historical Edmonton Data:
Feb 2022 – 191.1 oz of gold to buy the median house
Jan 2022 – 184.5 oz of gold to buy the median house
Jan 2010 – 253.4 oz of gold to buy the median house
Jan 2000 – 238.6 oz of gold to buy the median house
Jan 1990 – 97.6 oz of gold to buy the median house
Jan 1980 – 29.6 oz of gold to buy the median house
Calgary Jan 2022 – 224.9 oz of gold to buy the median house
Fort McMurray Jan 2022 – 215.3 oz of gold to buy the median house
Saskatoon Jan 2022 – 160.1 oz of gold to buy the median house
Toronto Jan 2022 – 568.4 oz of gold to buy the median house!
Vancouver Jan 2022 – 536.5 oz of gold to buy the median house!
What does this tell us? It gives us a gauge on home price inflation in Edmonton.
- If takes more gold (than previous months) to buy a house, the median house has appreciated against gold. This can signal home price inflation and that homes are becoming less affordable for the average Edmontonian.
- If takes less gold (than previous months) to buy a house, the median house is losing value to gold. This is a sign that Edmonton homes are depreciating in “actual value”, even though your home may sell for more money than last year. Other commodities are likely growing in value more than Edmonton real estate.
- If there is little change, things are stable.
- Gold will tend to perform well during financial crisis, while house prices tend to drop.
- My “Home Price to Gold” ratio is calculated by dividing the median sales price of a single family home in Edmonton by todays (post date) gold price for a 1 ounce coin in CAD.
- The median house price is the exact middle home price amongst all the single family homes sold this month in Edmonton (e.g. half the homes sold for less, half sold for more).
Buy Versus Rent (Price-to-Rent Ratio)
Feb 2022: $211,000 / ($1,239 X 12) = 14.19
Historical Data – Price-to-Rent Ratio:
Feb 2022 – 14.19
Jan 2022 – 12.65
Historical Data – condominium median selling price:
Feb 2022 – $211,000
Jan 2022 – $188,000
Historical Data – Average rent for a two-bedroom unit in Edmonton:
Feb 2022 – $1,239
Jan 2022 – $1,238
What does this tell us? This calculation helps us keep on eye on rental rates as well as general ROI with Edmonton investment properties.
- A price-to-rent ratio of 15 or less means it’s generally better to buy.
- A price-to-rent ratio of 21 or more means it’s generally better to rent.
- In-between? That means politicians are somehow doing a good a good job.
- MY price-to-rent ratio is calculated by dividing the condominium median selling price by THIS months average rent for a 2-bedroom apartment in Edmonton.
- Note: this is a very simplified calculation and a sophisticated buyer should consider many more data points such as neighborhood, types of condominium, family size, future plans, etc.
National Statistics
- National home sales edged up 1% on a month-over-month basis in January.
- Actual (not seasonally adjusted) monthly activity came in 10.7% below the record January in 2021.
- The number of newly listed properties dropped 11% from December 2021 to January 2022.
- The MLS® Home Price Index (HPI) rose a record 2.9% month-over-month and was up a record 28% year-over-year.
- The actual (not seasonally adjusted) national average sale price posted a 21% year-over-year gain in January.
Source:
The Canadian Real Estate Association (CREA)
Ottawa, ON, Feb 15, 2022
Other News For Edmonton
Things to Do in March in Edmonton
Must-See Winter Festivals in Edmonton
Making Space: building an Edmonton to love
Budget 2022: Moving forward | Budget 2022 : Aller de l’avant
Alberta to lift almost all remaining health restrictions
As COVID-19 hospitalizations continue to decline and pressure on the health-care system decreases, step two of the province’s path back to normal will begin on March 1.
Ready for 2022 wildfire season
Wildland firefighters and equipment have been deployed across the province in preparation for the upcoming wildfire season.
Red Deer Regional Airport expansion takes flight
Alberta’s government will provide a $7.5-million grant to expand infrastructure and services at the Red Deer Regional Airport.

Subscribe To Get This Report To Your Inbox!
Would you like to keep an eye on your most important investment?
Looking to invest in the Edmonton market?
Get this one-of-a-kind report every month for free!